

In welcome news for homebuyers, the number of listed properties offering price reductions climbed in May to levels not seen since 2016—with discounted homes now twice as common in the South and West as in the Northeast.
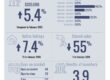
Price cuts were reported on 19.1% of all for-sale homes—the highest percentage for any May since at least 2016, and the fifth consecutive month with a growing percentage of reductions, according to the Realtor.com® May 2025 Inventory Report.
For comparison, in May 2024, the share of listings with price reductions was below 17%, signaling that sellers are increasingly willing to compromise to bring reluctant buyers to the closing table despite worsening affordability concerns.
“Price reductions have become more common in each of the past five months, a trend suggesting that sellers are adjusting their expectations in the face of affordability challenges and weaker buyer demand in some markets,” says Realtor.com Chief Economist Danielle Hale.
Regionally, the South and West each saw 21% of listings discounted in May, compared with just 11% in the Northeast—an area marked by a lack of inventory and frenzied demand.
Sun Belt cities are seeing the most price cuts

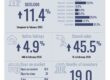
Of all the major metro markets, Phoenix boasted the greatest number of listings with price cuts, at 31.3%, up more than 7 percentage points from the same period last year amid rising inventory.
The typical home in Phoenix cost $525,000, representing a drop of more than 3% from May 2024.
Tampa, FL, saw the second-biggest share of discounted listings, at just below 30%. The median list price in the Sunshine State market stood at $417,500, having shed 1.6% compared with the same time last year.
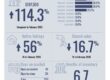
Coming in at No. 3, Denver had 29.4% of local home sellers slash prices on their properties last month.
The typical home in the “Mile High City” was listed for $600,000, down 5.8% year over year, and it sat on the market 14 days longer than before the COVID-19 pandemic.
According to Realtor.com senior economic research analyst Hannah Jones, all three of these metros have seen their inventory levels soar thanks to pandemic-era construction booms, but demand has since softened.
“As a result, more sellers are reducing their asking price in hopes of enticing buyers,” says Jones.

In Denver, there were just under 61% more listings in May than last year and 96.3% more listings than pre-pandemic. Tampa went through a slightly less pronounced shift, but still saw its listings climb by more than 30% since last May and 44.8% more than pre-pandemic.
Phoenix experienced a similarly sizeable growth with 24% more for-sale homes than a year ago and 26.7% more listings than in 2019.
Austin, TX, and Jacksonville, FL, rounded out the top five metros with the highest shares of listings with price cuts, at 29.2% and 28.8%, respectively.
Inventory levels increase, but price stays flat
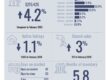
Looking at the overall state of the U.S. housing market, the typical home in the U.S. cost $440,000 in May, roughly flat since last year, while the price per square foot inched up by just 0.6%, signaling very limited home value growth.
For historical perspective, since May 2019, the typical list price has advanced by 37.5%, while the price per square foot was up 53.3%, significantly affecting affordability.
Zooming in on specific metros, Baltimore saw the biggest annual increase in the median list price in May, at more than 10%, while Austin experienced the biggest decline, at 6.3%.
The overall number of for-sale homes increased by 31.5% annually, marking the 19th straight month of year-over-year gains, and setting a new post-pandemic record. However, inventory still remains about 14% behind pre-COVID levels.
The West led the nation with the fastest-growing home inventory year over year, at more than 40%, followed by the South, at 32.9%. The Midwest and Northeast had more modest gains, at 22.9% and 19%, respectively.
But compared with pre-pandemic levels, only the West and South saw their inventories recover thanks to a surge in new construction, while the Midwest, and especially the Northeast, continued to struggle due to massive housing supply gaps.
At the metro level, all of the nation’s 50 largest cities recorded annual inventory gains, with Washington, DC, leading with 75.6%, followed by Las Vegas (66.8%) and San Diego (66.4%).
However, 28 of the 50 metros remained below pre-pandemic inventory levels. Notably, the 22 markets that have exceeded their 2017–19 norms were all clustered in the West and the South. Denver saw the strongest recovery, with its active inventory up a staggering 100% compared with pre-2020, followed by Austin (+69%) and Seattle (+60.9%).
According to Realtor.com economists, the striking regional differences come down to construction activity.
“Regions with little new construction since the pandemic, like New England and the Great Lakes, lag significantly behind their pre-pandemic inventory levels,” explains Hale. “Meanwhile, fast-growing metros known for their pandemic-era construction booms, like Austin and Denver, now have over 60% more active inventory than they did pre-2020.”
New listings see annual growth as buyers hesitate
New listings spiked 7.3% from last year, with fresh offerings emerging in every region and promising buyers more options. However, consumers remained hesitant in a climate of growing economic uncertainty surrounding President Donald Trump‘s trade and fiscal policies.
Milwaukee saw the most robust growth in newly listed properties year over year (+28.4%), with Charlotte, NC (20.5%), coming in second, and Boston (18.1%) rounding out the top three.
In a worrying sign, new listings edged down by 1.4% month over month, suggesting that this spring season might be more sluggish than normal, according to Hale.
Consequently, the total number of unsold homes was up by more than 20% year over year, and the typical home waited for a buyer for 51 days, six more than last May.
In the Northeast, where the demand is high and the supply is stubbornly low, the typical home lingered on the market just a day longer than in May 2024, indicating the local housing market’s faster pace compared with other regions.
“In some major metros, especially in the West, median time on market has now surpassed typical pre-pandemic levels,” says Hale. “Prices meanwhile remained stable, but a growing share of sellers reduced their asking prices, reflecting mounting affordability pressures and underscoring the initial mismatch between sellers’ preferred prices and buyers’ willingness to pay.”
Nashville, TN, experienced the biggest annual slowdown, with the median home there remaining on the market 19 days longer than last year.
Meanwhile, pending home sales—referring to homes under contract—ticked down 2.5% from last year, as a renewed increase in mortgage interest rates moving up toward 7% kept wary buyers away.
“Stubbornly high mortgage rates coupled with falling consumer sentiment is expected to weigh on buyer and seller activity during the spring buying season and beyond,” predicts Hale.
Realtor.com
JUNE 5, 2025